A building’s energy performance is dynamic throughout its 50+ year lifecycle. Changes to program use, system operations, equipment maintenance, codes and weather can greatly impact performance.
Understanding energy performance is important, especially for buildings seeking or governed by EUI and/or greenhouse gas emmissions thresholds. A building achieving these benchmarks in year one does not necessarily mean the same goal can be met in years 10, 20, or even 50.
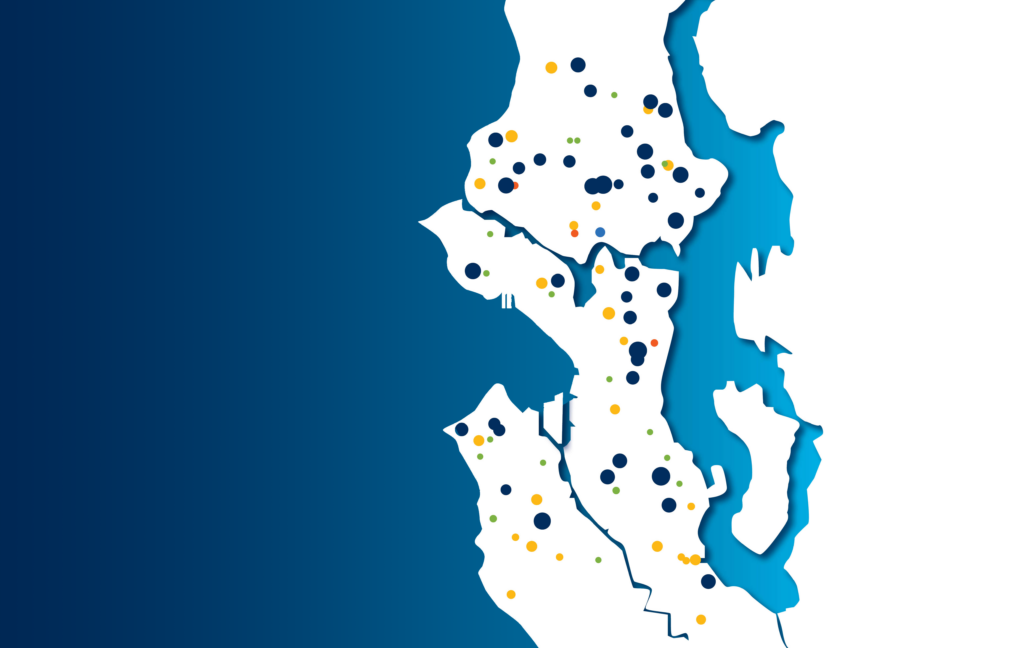
This is where data visualization can aid in predicting performance and shape system selection approaches that have a migration path for future modifications.
THE CHALLENGE The volume of data, influential factors (human behaviors, program changes, code, ordinances, and legislative mandates), and options for meeting system performance goals are vast and complicated.
THE APPLICATION The art of communicating the science supports the education, planning, and implementation of key capital programs at an enterprise level.
THE OPPORTUNITY Leveraging the building model and analytical software to synthesize this information into powerful visual graphics, discernable by a broad cross-section of stakeholders regardless of technical background, fuels consensus-building and informed decision-making.